
Detect structural issues, illness indicators and branch-failure risks from any visual data, from smartphone photos to camera frames, so teams focus on the trees that need attention first.
Capabilities
What it does
Defect detection
Computer vision flags cavities, dead wood, cracks and leaning stems.
Risk prioritisation
Every tree gets a risk score so crews go where they are needed most.
Change over time
Compare repeated inspections to track growth and decline.
How it works
Three steps, no manual re-entry.
- 01CapturePhotograph or film the trees on your inspection route with any camera.
- 02AnalyzeAI models assess structure and health indicators.
- 03DecidePlan maintenance from a prioritised work list.
Perception
Every branch, mapped and inspected.
Image
One photo or video frame of the tree. No special hardware.
Branches
Stem and every visible branch are separated from the background.
Skeleton
The branches become one connected structure, from trunk to twig.
Inspection
Findings are located on the tree and ranked for your crew.
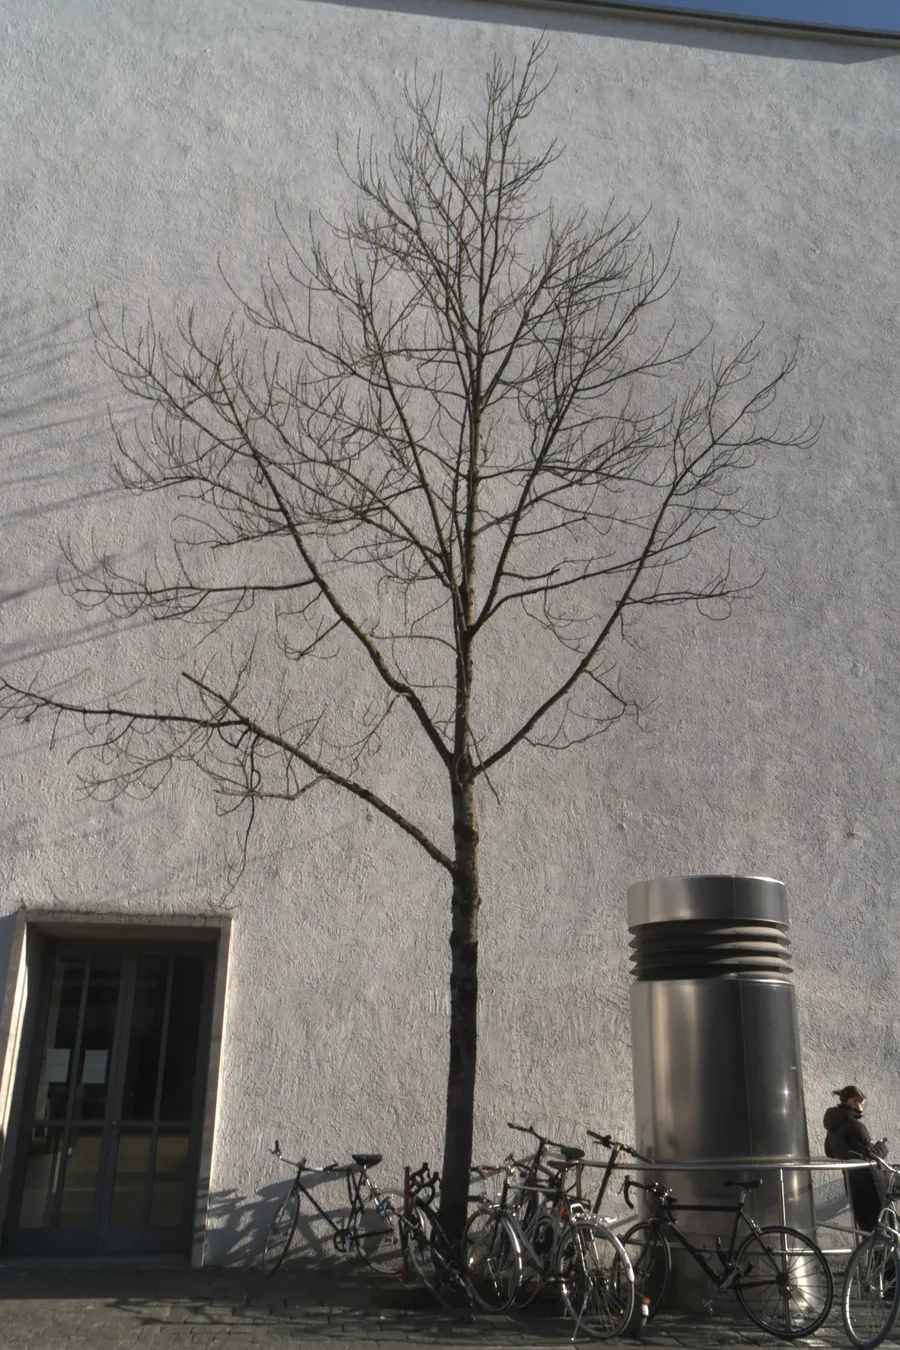
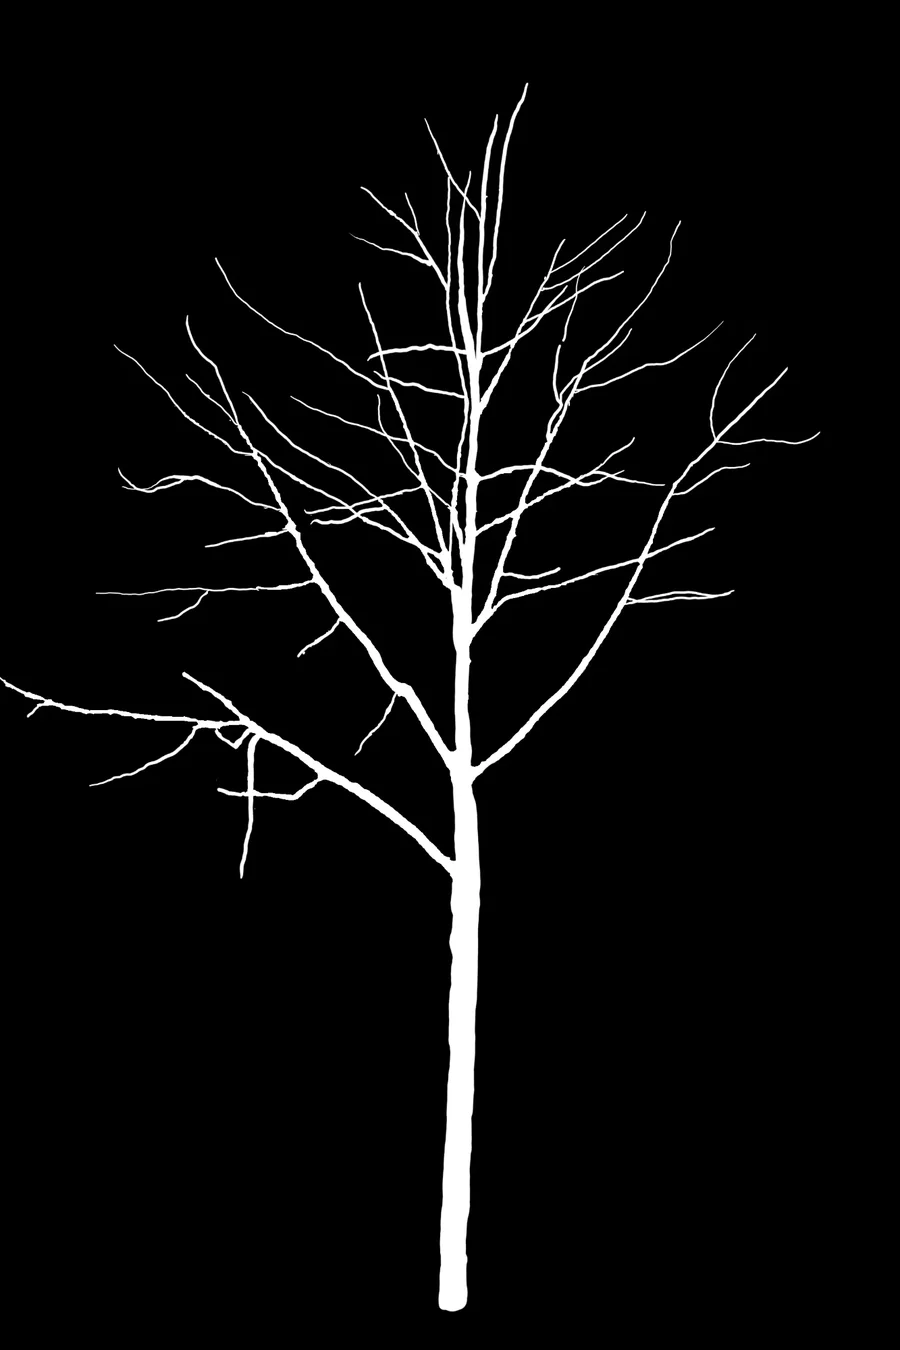
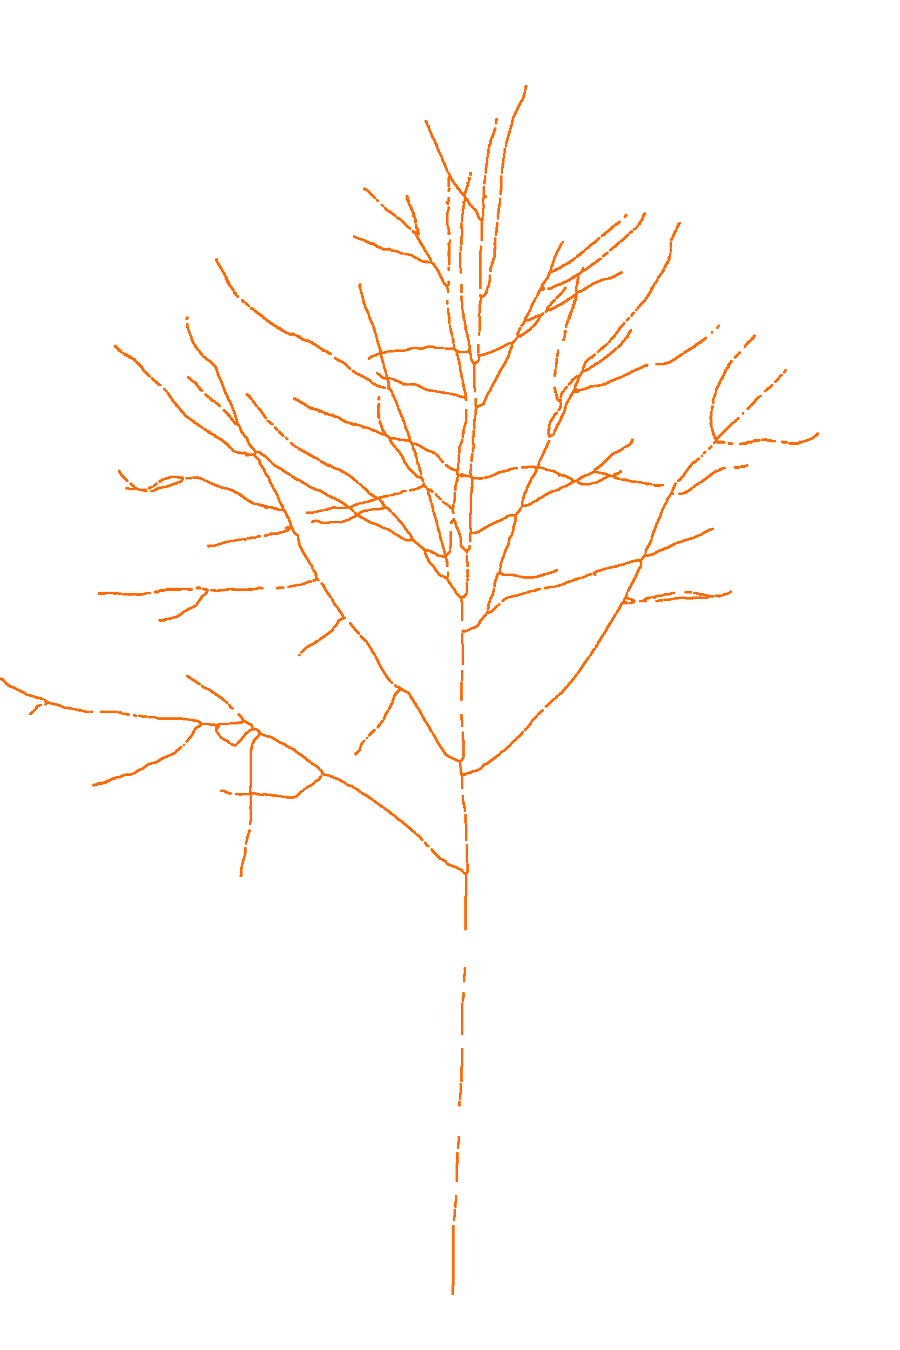 Image
Findings shown for illustration
Further analysis
How much wind does each crown catch?
From the same data, Darbots computes the canopy area each tree turns to a wind across the street. Shown here for a 29 m black poplar on a 2 km alley.
Populus nigra · tree 002
0.00 m²
Wind capture area
Wind across the street
L 192 · 181 street trees
- total canopy area facing the wind
- 12,930 m²total canopy area facing the wind
- median per tree (8.6 – 250.5)
- 63.6 m²median per tree (8.6 – 250.5)
- street trees among the surveyed alley trees
- 181 / 217street trees among the surveyed alley trees
Arborica · L 192 Radolfzell / Moos · wind capture report, Oct 2026
What you get
Data your team can use on day one.
- Risk score per tree01
- Detected defects with images02
- Prioritised maintenance list03
- Inspection reports (PDF)04
Solutions